
The Worst Drivers In The States, According T0 250,000 Motorists
October 03, 2022
Anyone who has been driving long enough has felt like the lone sane driver in a sea of maniacs. In one study proving our tendency to overestimate our own driving ability, 70.1% of motorists reported that they were better-than-average drivers – a statistical improbability. While it is easy to understand why most drivers may perceive themselves as above average, it is less easy to determine if they are correct. Outside of data on extreme events like car accidents and drunk driving fatalities, there is little data available to assess the day-to-day behaviors of the average motorist – and how they may vary across the country.
Luckily, the internet has given motorists a public forum to air their grievances. While in an earlier era, the shouts of frustrated drivers were often lost amidst a sea of honks and idling engines, today’s motorists can memorialize their complaints on the internet for all of posterity. With the resulting data, researchers can now answer the question so many frustrated U.S. motorists have asked themselves after getting cut off, tailgated, or sped past by a sports car – are these the worst drivers in the country, or what?
To determine which cities and states are home to the worst drivers, The Clunker Junker reviewed thousands of tweets from across the U.S. to reveal where drivers have the most negative things to say about fellow motorists.
What We Did
We reviewed over 250,000 driving-related tweets from across the country containing the word “drivers” followed by each state’s name (or demonym), the top 100 cities in the U.S. and a list of the top car brand names. We then analyzed the sentiment of each tweet using an AI algorithm from HuggingFace and ranked states, cities, and car brands based on the percentage of driving-related tweets that have a negative sentiment.
Key Findings
- The state with the worst drivers is Rhode Island. On Twitter, 71.0% of tweets about the Ocean State are negative.
- Many of the states with the worst driver reputations have fast-growing populations and increasing traffic congestion. In 6 of the 10 states with the worst driver reputations, the average travel time to work grew faster than the U.S. average from 2016 to 2020.
- A majority of the 20 cities with the worst driver reputations are in the Sun Belt states of Arizona, Texas, Florida, Tennessee, North Carolina, and Georgia.
- Urban traffic congestion may increase the negative perception of other drivers. Houston and Miami rank as having the 8th most hours lost due to traffic congestion of any city and rank as having the 3rd and 4th worst drivers.
- Luxury sports car brands like BMW, Maserati, Lamborghini, and Mercedes have some of the worst driver reputations.
Sun Belt States Have the Worst Drivers
While research has shown that the vast majority of car accidents are caused by human error – as opposed to environmental conditions or vehicular failures – in some states poor driving conditions may boost the perception of poor driving behavior. According to data from the Federal Highway Administration, for example, 26% of rural roads and 42% of urban roads in Rhode Island are in poor condition – by far the most of any state. Bumpy roads and poor driving conditions may be one reason why 71.0% of tweets about Rhode Island drivers are negative – the most of any state.
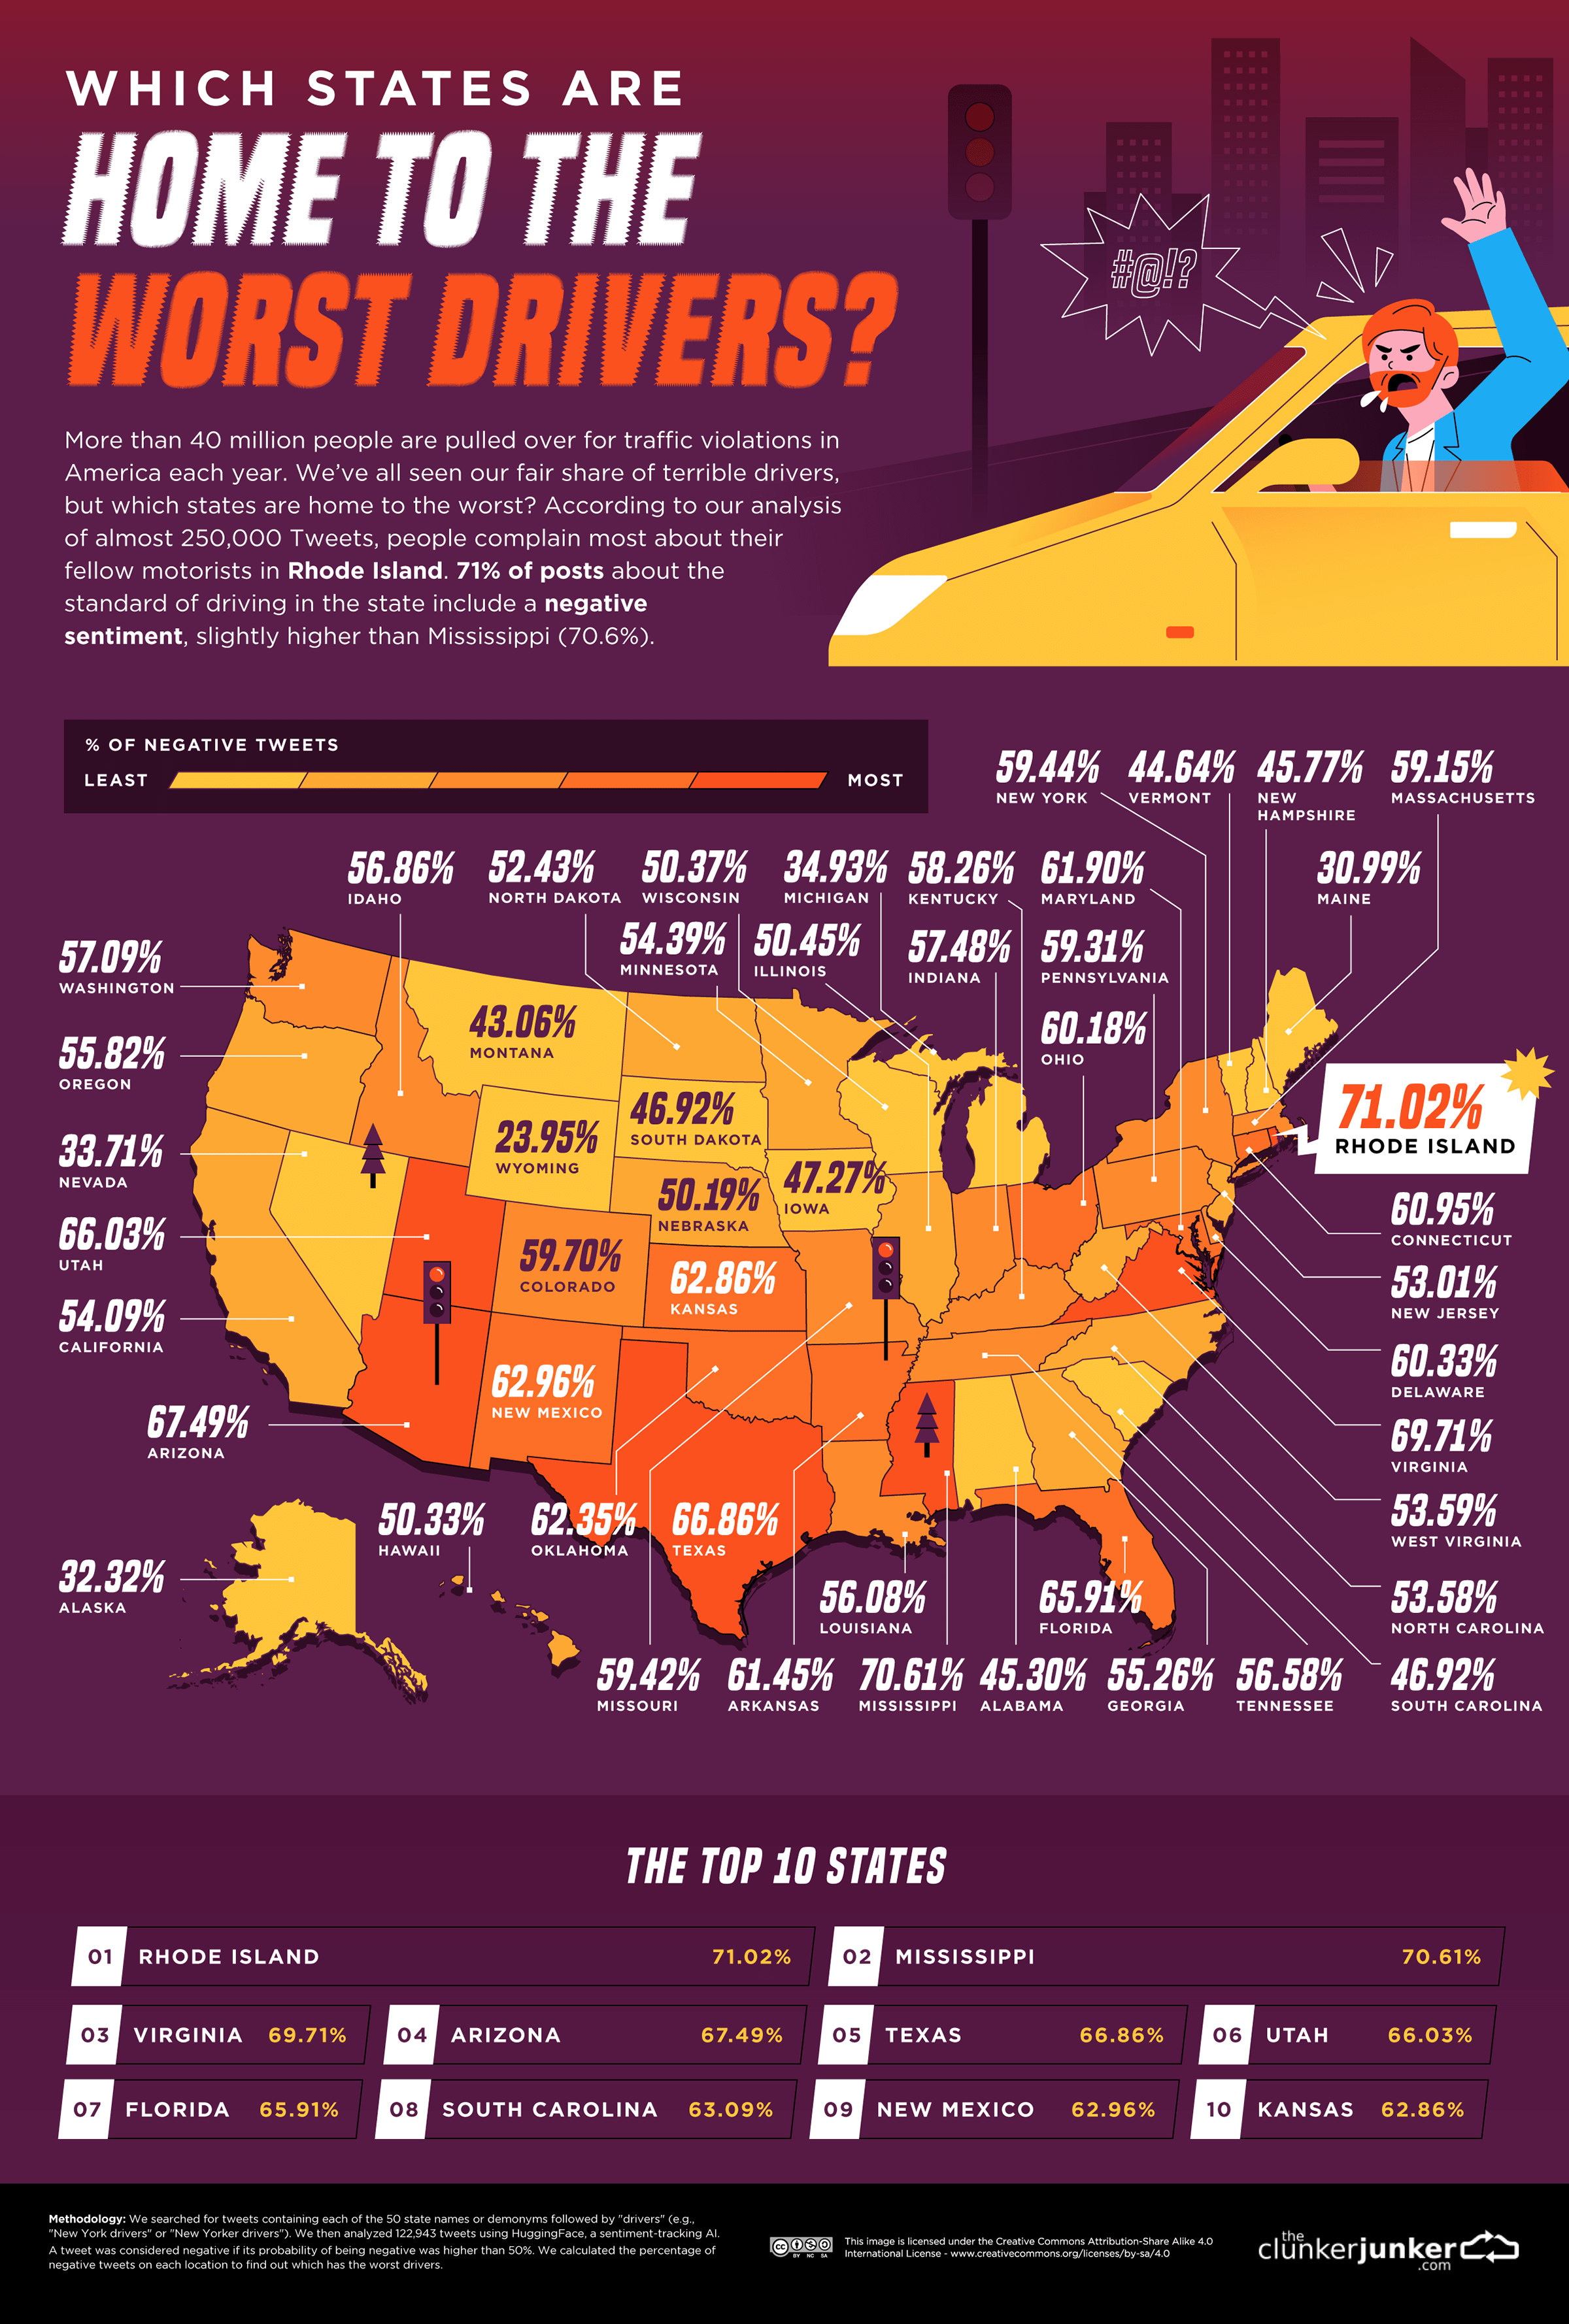
In other states, negative attitudes towards other drivers may be the result of increased traffic congestion. Many of the states where driving attitudes are the worst have fast-growing populations, which are likely causing congestion to increase and commute times to lengthen. Five of the 10 states with the highest percentage of negative driver tweets – Arizona, Texas, Utah, Florida, and South Carolina – are also among the top 10 fastest growing states, according to 2016 and 2020 Census Bureau population data.
While the mean travel time to work increased faster than the U.S. average from 2016 to 2020 in six of the top 10 states with the worst driving attitudes, it declined or rose at a slower rate in all of the 10 states with the best driving attitudes. Worsening congestion due to the influx of new drivers may be one reason behind the increased negativity on the road.
Drivers In Congested Cities Have Worse Attitudes
While large, dense Northeastern metropolises like New York and Boston are stereotyped for having rude drivers, many of the cities with the worst drivers, according to Twitter, are in the Sun Belt. Drivers in cities in Sun Belt states like Arizona, Texas, and Florida have the lowest opinion of their fellow motorists, with more than 65% of driving-related tweets containing negative sentiment.
Is everyone bad at driving, or is it just you? Drivers get frustrated in traffic and are more likely to develop negative opinions of their fellow motorists – or worse. In a 2018 study published in the Journal of Public Economics analyzing congestion in Los Angeles, researchers found that extreme traffic was associated with a 9% increase in domestic violence. It is no secret that traffic makes people angry, which may be one reason why many of the cities with the worst driver attitudes also have bad or worsening congestion.
According to data from transportation analytics company INRIX, the average commuter in both Houston and Miami lost 35 hours due to congestion in 2020 – tied as the eighth most of any U.S. city. Extreme traffic may be one reason why 75.1% of tweets about Houston drivers have a negative sentiment – the third largest share of any city. Similarly, 73.6% of tweets about Miami drivers have negative sentiment, the fourth largest share of any city.
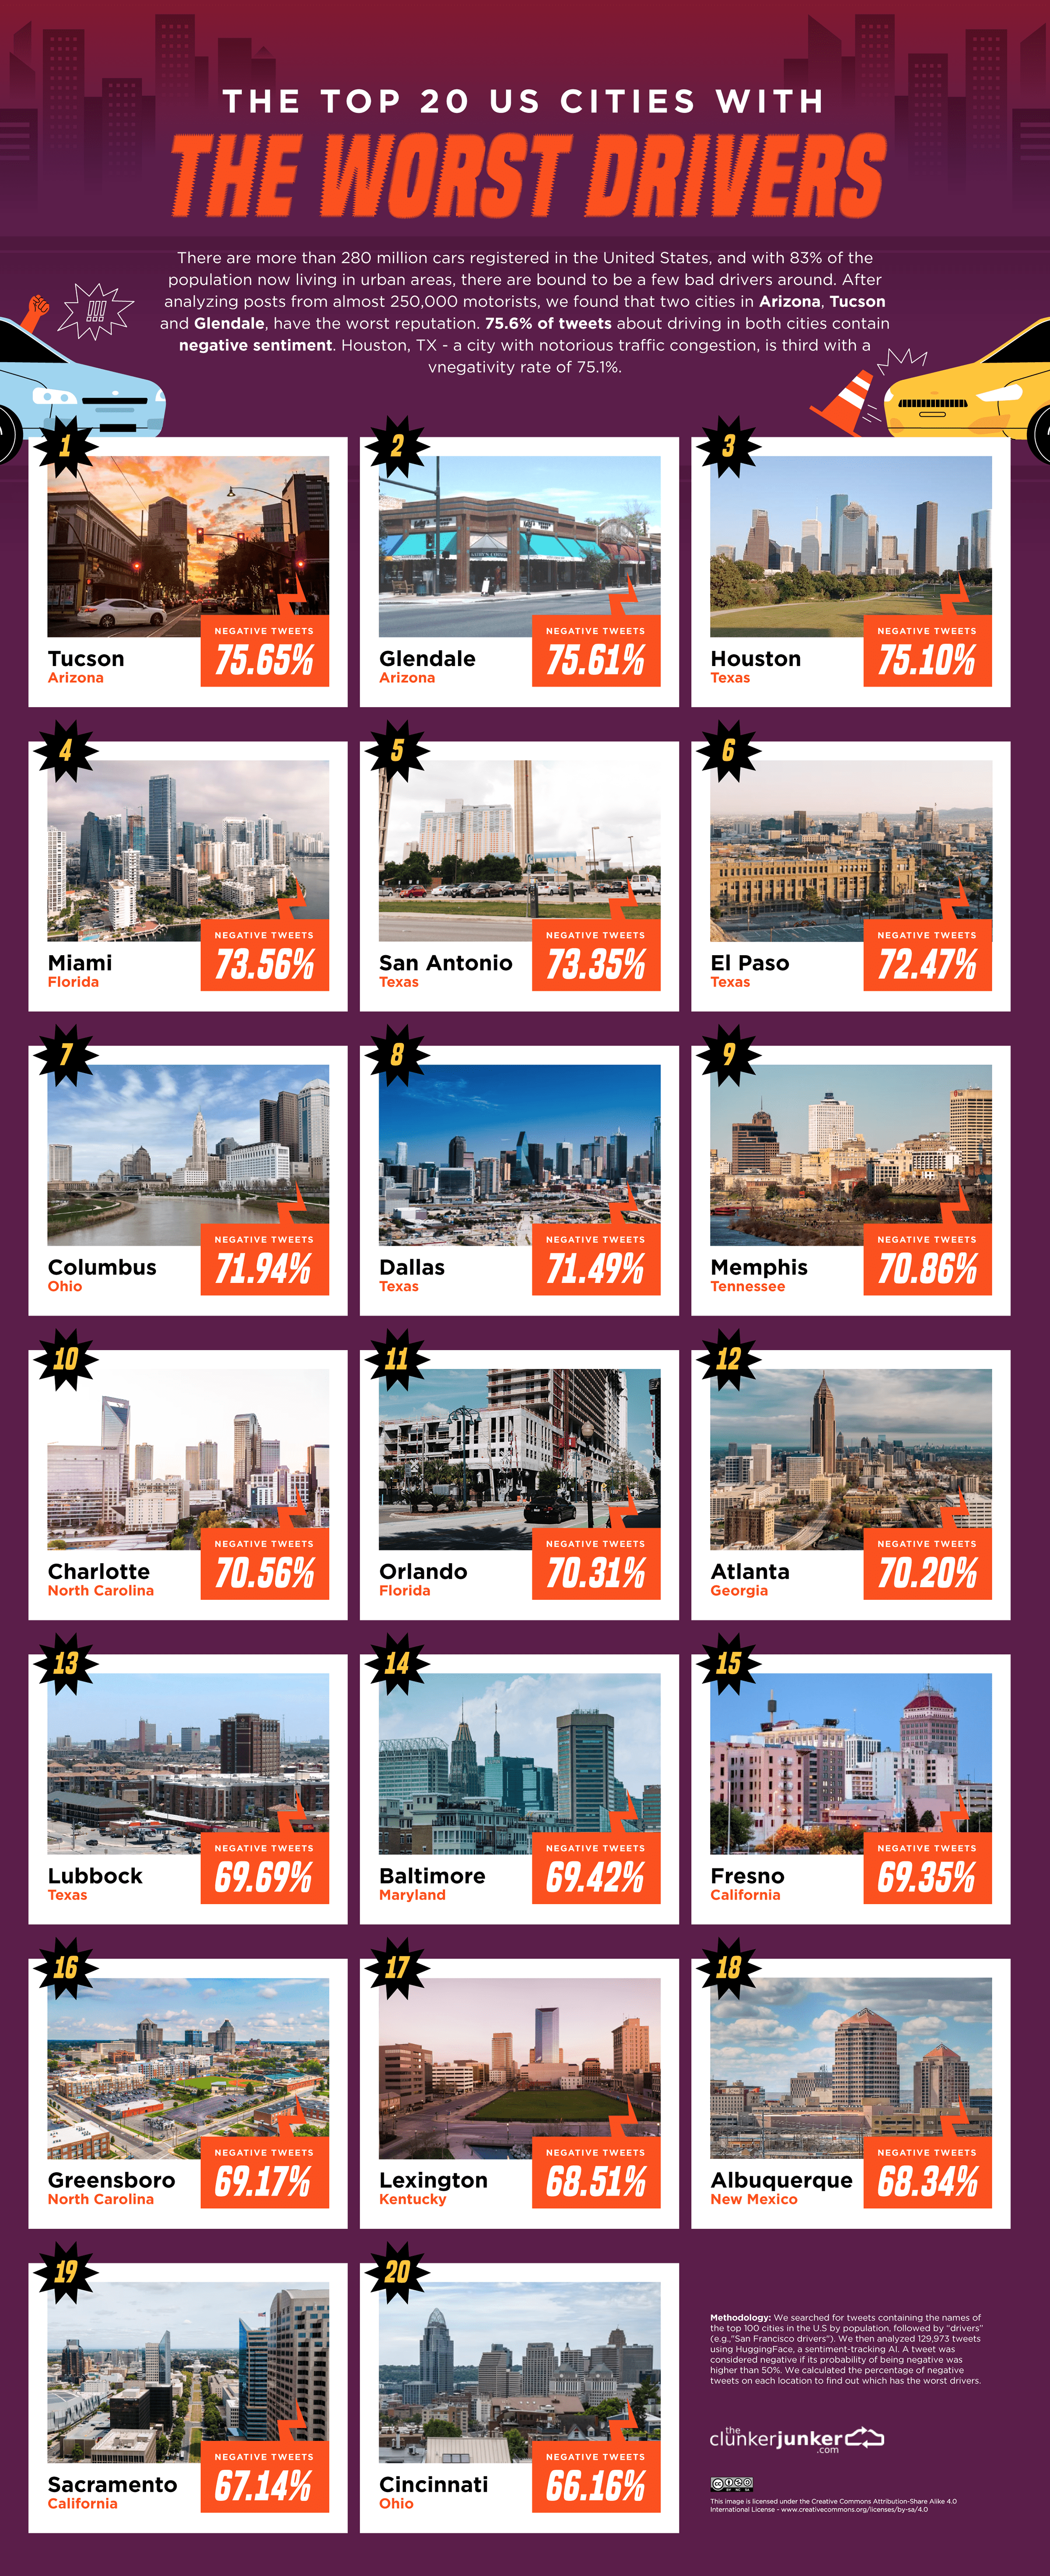
While a bulk of the top 20 cities with the worst driver attitudes are in the Sun Belt, there are several outliers. In Columbus, Ohio, for example, 69.4% of driver-related tweets are negative – the seventh largest share of any U.S. city. Other cities that stick out include Baltimore, Maryland; Lexington, Kentucky; and Cincinnati, Ohio.
BMW Drivers Have the Worst Reputation
What does your car say about you? Car brands have personalities, embodied by the people who drive them. In a study by YouGov measuring personality traits associated with car brands, for example, BMW owners were most likely to identify as knowledgeable, Mercedes owners as adventurous, and Dodge owners as bighearted.
In the eyes of others, however, car brands are often associated with negative traits. According to sentiment analysis from HuggingFace, 58.0% of tweets about BMW drivers are negative, the most of any car brand. One particular negative stereotype about the brand – that BMW drivers don’t use their turn signals – is so prevalent that in June 2022, the automaker tweeted from its official account encouraging its drivers to use their blinkers.

The car brand with the second worst reputation is Nissan, with 57.3% of tweets about Nissan drivers containing negative sentiment. Much of Nissan’s poor reputation may be due to the negative perception of one specific model – the Nissan Altima. On sites like Twitter and Reddit, users regularly discuss and debate just why Nissan Altima owners are such bad drivers. One theory posits that the model’s continuously variable transmission (CVT) encourages drivers to accelerate at inappropriate times, while another claims that the car’s affordability emboldens Altima owners to drive recklessly.
Other brands with the worst driving reputations include manufacturers of sports cars, known for their flashy design and aggressive drivers. Sentiment analysis shows that 51.1% of tweets about Maserati, for example, are negative – the fifth largest share of any car brand. Other luxury sports car brands with negative reputations include Lamborghini and Mercedes.
You’re Not In Traffic; You Are Traffic
Are you a bad driver? Perception of driving ability may be subjective and dependent on the personality of each individual driver. In one 2020 study, for example, extroverted drivers were more likely to accelerate in risky driving scenarios, while conscientious drivers were more likely to pump the brakes. Different personality types have different beliefs about what a driver should do when, and all motorists overestimate their own driving ability in comparison to others.
While negative attitudes toward drivers are subjective and do not correlate with outcomes like driving fatalities per capita, they do correlate with population growth and congestion. Drivers in cities and states with fast-growing populations and rising commute times are more likely to have negative attitudes towards their fellow motorists.
So next time you tweet about how fast or slow the car in front of you is going, just remember the car behind you may be doing the same thing. But also be aware of worsening traffic in fast-growing areas and how increased congestion may ultimately impact driver moods, behavior, and overall well-being. So next time you get cut off or someone fails to signal, ask yourself – are these the worst drivers in the country? And you may have an answer.
Methodology
To find out which state has the worst drivers, we searched for tweets containing each state’s name or demonym followed by “drivers” (for example, “New York drivers” or “New Yorker drivers”). To obtain city-level data, the same search was carried out, but with the names of the top 100 cities in the U.S by population (“San Francisco drivers”). The brand-level data was obtained by retrieving tweets that had the brand name followed by “drivers” or “driver” while also being geolocated on the top 300 cities by population in the U.S.
We limited accounts to a maximum of one tweet per day to account for bots. Also, to ensure further variability, only up to a total of 10 tweets were considered from the same account. We analyzed each tweet sentiment using an AI algorithm from HuggingFace, which allowed us to extract the probability of a tweet being negative. A tweet was considered negative if its probability of being negative was higher than 50%. We calculated the percentage of negative tweets on each location to find out which has the worst drivers.
The data was collected in June 2022.